
Graphing every idea in history
Flowing Data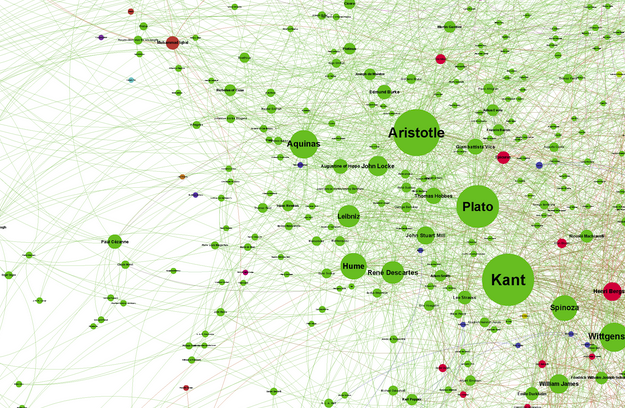
In people’s Wikipedia profiles, you’ll often read that they influenced someone or were influenced by someone. Take that data, graph it and you’ll get a fascinating visualisation.

From Weekly Filet #77, in July 2012.
💔 Some older links might be broken — that's the state of the web, sadly. If you find one, ping me.