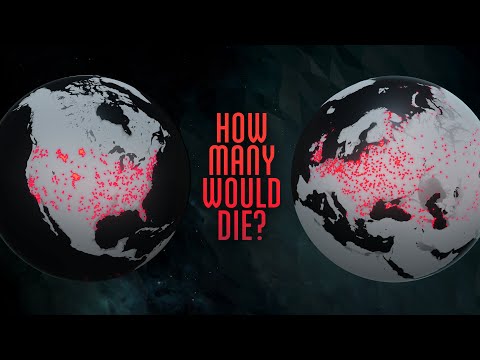
Remember «The Fallen of World War II»? Its creator is back with a new project, «a web series that combines data-visualization and cinematic storytelling to explore the driving factors of war and peace». Impressive.
From Weekly Filet #243, in August 2017.
🔗
Men have all the gadgets, women – or should I say: girls? – have all the mental powers, even divine powers.
From Weekly Filet #240, in July 2017.
🔗
An homage to Hans Rosling, who knew how to bring data to life and tell stories with it.
From Weekly Filet #228, in February 2017.
🔗
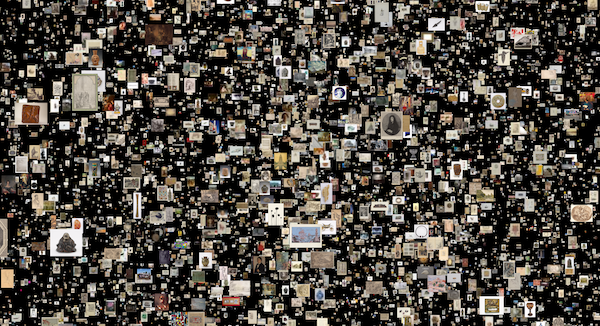
A rather trippy experience: Explore thousands of artworks in virtual, three-dimensional space. And somehow, time passes quicker in this space, I’ve come to realise.
From Weekly Filet #225, in January 2017.
🔗
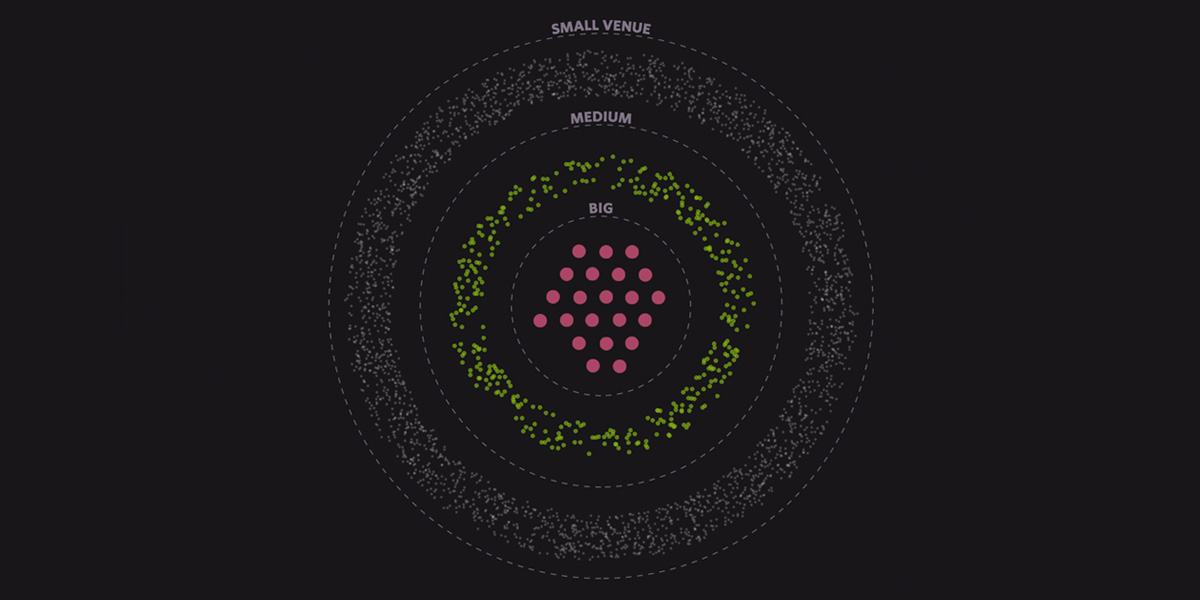
«What three years and 75,000 shows in New York tell us about the chance your favorite band will succeed.» Interesting visual essay with stunning graphics.
From Weekly Filet #225, in January 2017.
🔗
Excellent analysis, very nicely presented.
From Weekly Filet #-1, in January 2016.
🔗
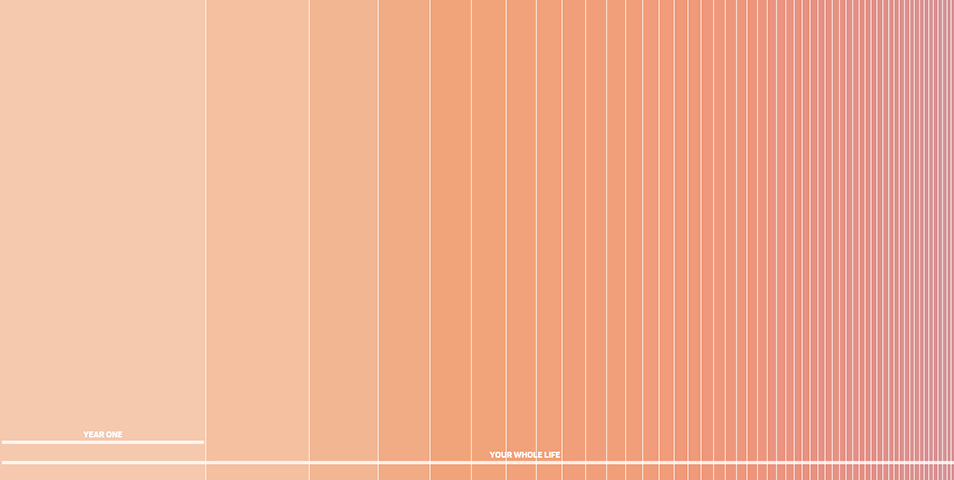
Why is it that time seems to fly by faster the older you get? Nice visual explanation.
From Weekly Filet #218, in July 2015.
🔗
This «histomap», made in 1931, is taken from a page in an old book. It’s an amazingly intuitive way to view the flow of world history over the last 2,000 years. To read the small font, click the map (and then click again to enlarge) for a higher-res version.
From Weekly Filet #218, in July 2015.
🔗
Most maps make Greenland appear huge. It isn’t. This is a great tool to compare actual sizes of countries, continents or oceans. Expect to be surprised.
From Weekly Filet #214, in June 2015.
🔗
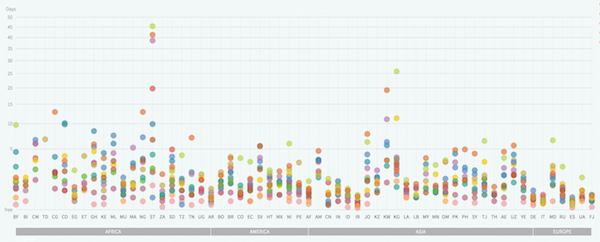
The same essential drugs, vastly different prices across the globe. A complex investigation on the affordability of medicines.
From Weekly Filet #, in June 2015.
🔗
Make sense of what matters, today and for the future.
Every Friday, carefully curated recommendations on what to read, watch and listen to. Trusted by thousands of curious minds, since 2011.
Undecided? Learn more | Peek inside