I can’t get this data visualisation out of my mind. It’s both magical and disturbing to watch a human heart beat (even more so if you open your laptop to compile the Weekly Filet only to see «heartrate undefined bpm»).
From Weekly Filet #156, in March 2014.
🔗
Say you’re given a sequence of 20 random numbers and are tasked with sorting them from lowest to highest. How do you do that? There are quite a number of strategies. You could divide them into groups and refine as you go. Or you could always compare two adjacent numbers and put the lower of the two to the left. And so on. Computers have to do sorting operations all the time. Data visualisation designer Carlo Zapponi has found a fascinating way to illustrate how different sorting algorithms work (and how they compare in efficiency). Sounds a bit dull? Have a look for yourself and discover that it really isn’t.
From Weekly Filet #154, in March 2014.
🔗
Like no other: A visualisation of the world’s population, inspired by Joy Division’s iconic «Unknown Pleasures» cover.
From Weekly Filet #154, in March 2014.
🔗
Beautiful visualisations of the weather in 35 cities around the globe, day by day.
From Weekly Filet #150, in February 2014.
🔗
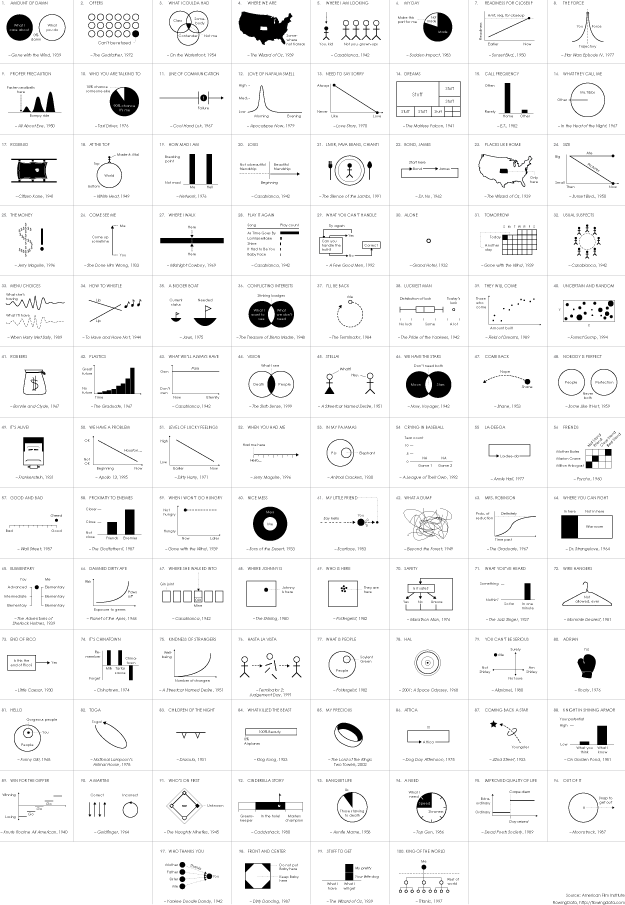
And for an entertaining challenge: 100 famous movie quotes as charts. It will feel like this: *gazesandthinkshard* – «Ha, that’s a great one!»
From Weekly Filet #146, in January 2014.
🔗
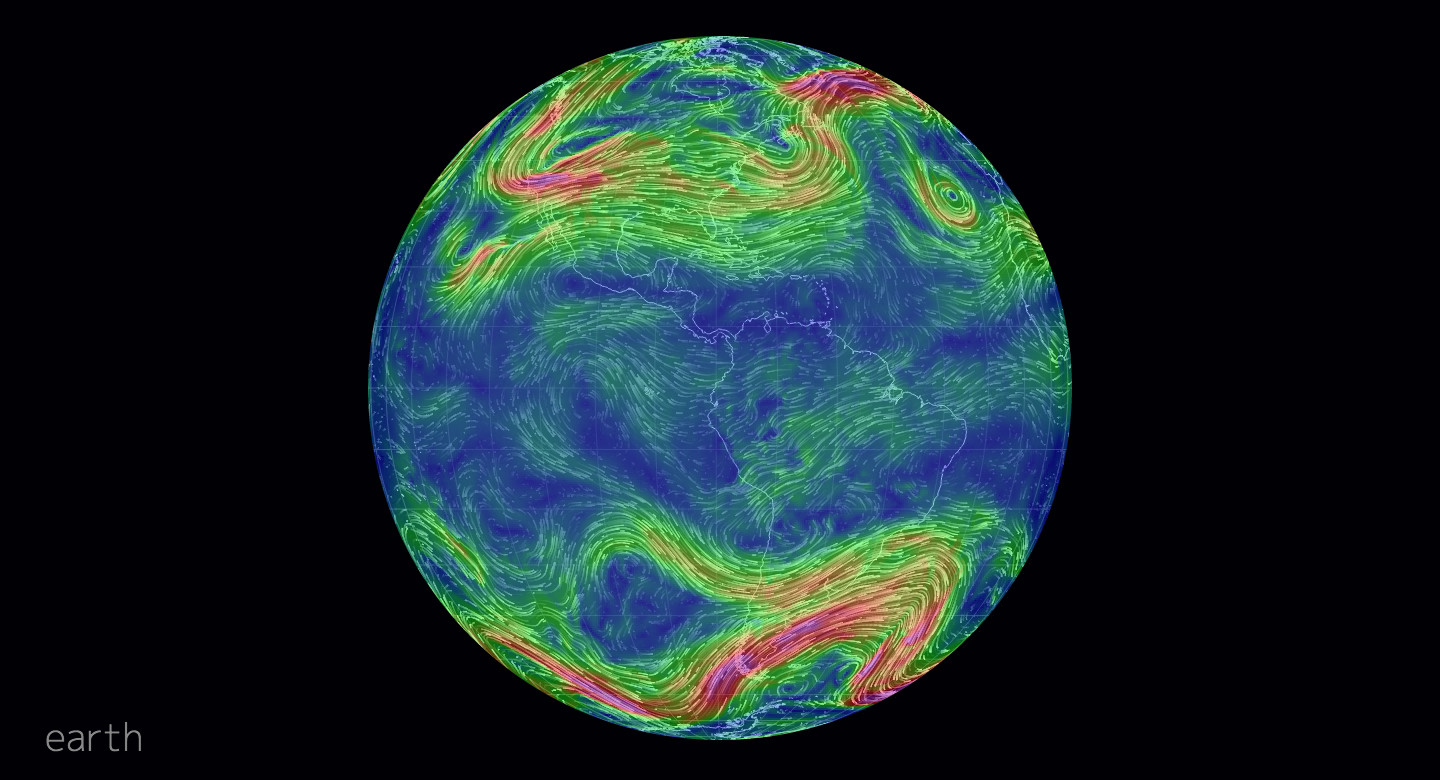
The most beautiful thing on the web right now: All the world’s winds, visualised in realtime. It looks like a Van Gogh in the making.
From Weekly Filet #142, in December 2013.
🔗
A great collection of infographics and data visualisations from 2013. The one about the most contested Wikipedia articles is my favourite.
From Weekly Filet #141, in December 2013.
🔗
The very best of data visualisation and information design. The 2013 winners of the «Information is Beautiful Awards» have been announced. If you have the time, have a look at the shortlist and the longlist, too, if only to see how high the standards were.
From Weekly Filet #138, in November 2013.
🔗
And now for the best news of the week: «Wasting time, they say, can make you more creative. Even seemingly meaningless activities such as watching cat videos on YouTube may help you solve math problems.»
From Weekly Filet #137, in November 2013.
🔗
A friendly reminder: It’s not enough to have seen and tweeted out this piece. Read and watch it from top to bottom. It’s the best, most comprehensive piece on the most important story of the year.
From Weekly Filet #136, in November 2013.
🔗
Make sense of what matters, today and for the future.
Every Friday, carefully curated recommendations on what to read, watch and listen to. Trusted by thousands of curious minds, since 2011.
Undecided? Learn more | Peek inside